


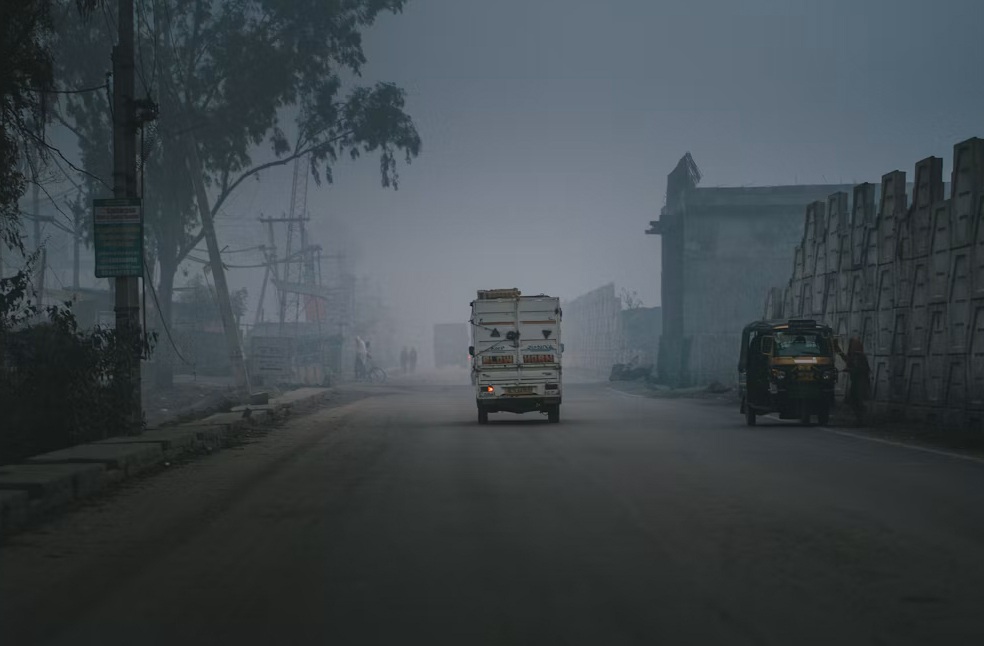
New Delhi: Delhi overtook Pakistan’s Lahore on November 13 to become the world’s most polluted major city as air quality deteriorated to hazardous levels, with dense smog reducing visibility across the national capital.
Swiss air quality monitoring group IQAir recorded Delhi’s Air Quality Index (AQI) at 334, placing it at the top of its global pollution rankings. Meanwhile, India’s Central Pollution Control Board (CPCB) reported a higher AQI of 403, categorising the city’s air quality as ‘severe’.
The difference between the two readings is attributed to the distinct AQI scales and calculation methods used by the Swiss monitoring organisation and Indian authorities. An AQI between zero and 50 is generally considered good, indicating minimal health risks.
Thick smog covered several parts of the city, with vehicles struggling through reduced visibility on major roads. Videos shared by news agency ANI showed cars and motorcycles emerging from the haze, while street lights were barely visible in some areas.
Air pollution is a recurring winter challenge across northern India and neighbouring Pakistan. During colder months, stagnant and heavy air traps pollutants from vehicles, construction activities and agricultural residue burning, contributing to a deterioration in air quality.
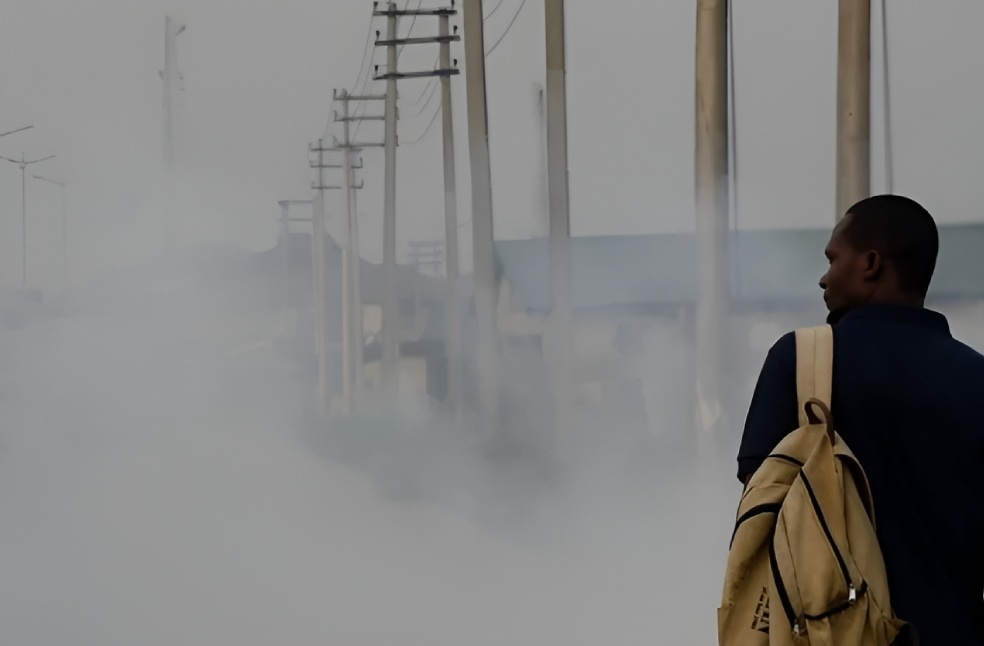
Delhi’s AQI reaches 403 as several areas record severe pollution
Delhi entered the severe air quality category for the first time this season on Friday morning, with the city’s average AQI reaching 403.
According to the CPCB’s Sameer application, the reading stood at 403 at 6.05 am and remained unchanged at 8 am and 9 am. The official 24-hour average for the day was scheduled to be calculated at 4 pm.
Of the 58 monitoring stations reporting data at 8 am, 33 recorded severe pollution levels, 24 fell into the very poor category and one registered moderate air quality.
IIT Delhi recorded the highest AQI at 488, followed by Chandni Chowk at 479 and Delhi University’s North Campus at 478. Burari Crossing registered 456, while ITO and Jawaharlal Nehru University both recorded 451.
Other locations reporting severe air quality included Jahangirpuri at 430, Wazirpur at 427, Anand Vihar at 419, Rohini at 413, IGI Airport Terminal 3 at 403 and Tikri Kalan at 402. At 6.05 am, IIT Delhi had recorded an AQI of 487, while North Campus and Chandni Chowk registered 476 each. Pusa recorded 468 and NSUT Jaffarpur stood at 461.

The CPCB classifies AQI readings between zero and 50 as good, 51–100 as satisfactory, 101–200 as moderate, 201–300 as poor, 301–400 as very poor and 401–500 as severe. Delhi’s previous severe air quality day was recorded on January 19, when the 24-hour average AQI reached 410.
GRAP Stage III restrictions remain in force across NCR
The Commission for Air Quality Management (CAQM) introduced Stage III of the Graded Response Action Plan (GRAP) across the National Capital Region on November 6, anticipating further deterioration in pollution levels.
The restrictions include:
- Suspension of several construction and demolition activities that generate dust across the NCR.
- Closure of stone crushers and restrictions on mining operations.
- Restrictions on BS-III petrol and BS-IV diesel or older light motor vehicles in Delhi and high-vehicle-density districts, including Gurugram, Faridabad, Sonipat, Ghaziabad and Gautam Buddha Nagar.
- Restrictions on the entry of certain diesel-operated BS-IV and older goods vehicles into Delhi.
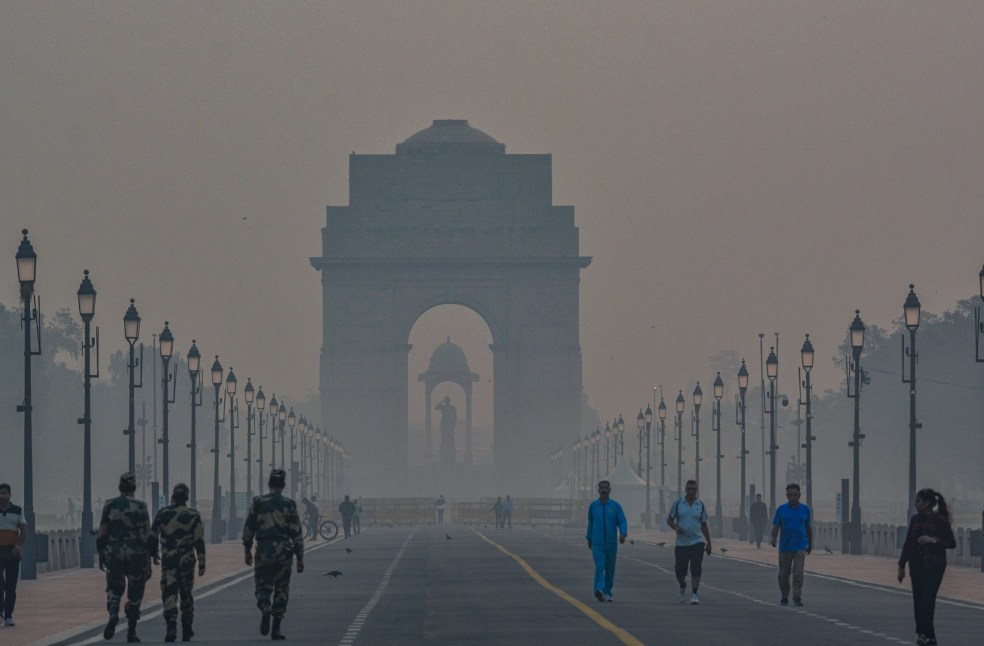
If the 24-hour average AQI crosses 450 and enters the ‘severe plus’ category, Stage IV of GRAP, the highest level of anti-pollution measures, is triggered. The minimum temperature at Safdarjung was recorded at 16.2 degrees Celsius, 2.7 degrees above normal.
Biomass burning and organic aerosols drive pollution levels
Source-apportionment estimates from the Indian Institute of Tropical Meteorology (IITM) identified biomass burning and secondary organic aerosols as the leading contributors to Delhi’s pollution load on Thursday, each accounting for 25.4 percent.
Vehicular emissions contributed 17 percent, while secondary inorganic aerosols accounted for 11.8 percent. The breakdown of secondary inorganic aerosols included nitrate at 4.9 percent, ammonia at 4.1 percent, and sulphate at 2.9 percent.
Mixed combustion contributed 10.7 percent, followed by firecrackers at 7.1 percent. Waste burning, including municipal and plastic- and rubber-containing waste, accounted for 1.5 percent. Mineral dust and ash contributed 0.9 percent, while industrial emissions made up 0.2 percent.
Experts explained that secondary organic aerosols develop through chemical reactions in the atmosphere. Their sources include emissions associated with certain industries, petrol and diesel vehicles, and biomass burning.
MOST READ | Are expensive cold and flu medicines worth the extra cost?